|
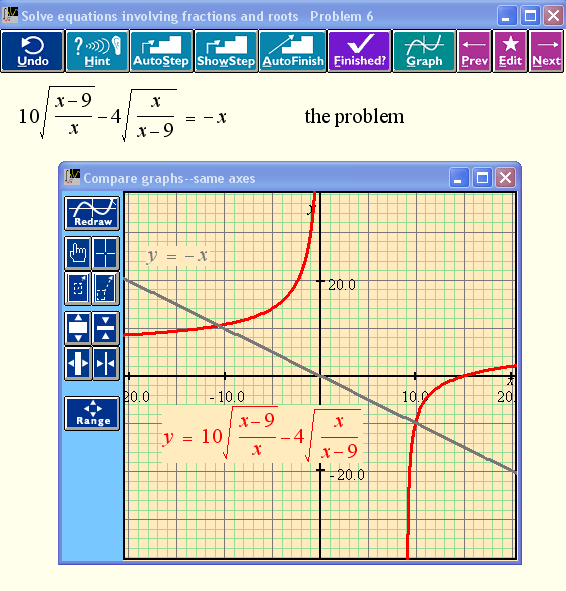
When you press the Graph button, you immediately get a graph of the expression or equation in the current calculation. MathXpert will choose the portion of the graph to be displayed so that interesting features (solutions of equations, maxima, minima, inflection points) are displayed. In the example shown, you could use the Point and Slope tool (upper right on the Graph Toolbar) to see the numerical value of points on the graph, in particular the intersection points of the two graphs. Those will be the solutions of the equation. In this way you can easily compare the graphical solution to the symbolic solution you find in the calculation window. 
|
Help With Math: Purveyors of MathXpert
-->
